Overview
Overview is the screen Xchange opens with. It answers two questions: Do I need to do something right now? and Is operation running smoothly? What needs to be done is at the top; how it is going is below.
Almost everything on this screen leads further. A row in Action required jumps to where the matter can be settled, a running run opens its history, a section of a column in the chart the jobs of its hour and its status. Clarifying and intervening happen elsewhere — the overview is the place from which you get there.
Permissions
The overview has no permission of its own. Everyone who may open Xchange sees it — namely the section that their own permissions show. Each part depends on one permission, and Read only is enough in each case:
| Permission | What it shows on the overview |
|---|---|
| System | the row about the state of the system in Action required |
| Connections | the row about blocked connections |
| Routes | all rows that concern a route |
| Clarification | the row about open clarifications |
| History | Running now, the key figures and the columns in the chart |
The page shows what your permissions cover; the rest is left out without notice, and the page is then shorter. This also applies to the note Nothing to clarify: It says that nothing is open in your section — more can be open in the system as a whole. Who grants which permissions is described under Permissions.
Layout
| Area | What it shows |
|---|---|
| Header | the title Overview, below it the greeting, on the right the note Nothing to clarify |
| Action required | every matter that someone needs to handle, one row per matter |
| Running now | the runs that are working at this moment, with progress |
| Key figures | four tiles about the whole system |
| Operations — last 24 hours | a column chart over the past 24 hours, one column per hour |
In this order. Action required and Running now appear only when they have something to show — instead of graying out, this screen leaves out empty areas. An overview without action required therefore starts directly with Running now, and when nothing is running, with the key figures.
The greeting
Good morning, Good afternoon or Good evening, followed by your first name. The boundaries are at 11 AM and 6 PM, by the clock of your computer.
Xchange takes the first name from the employee master data of SAP Business One. If your user lacks the link to an employee, your user name is shown there.
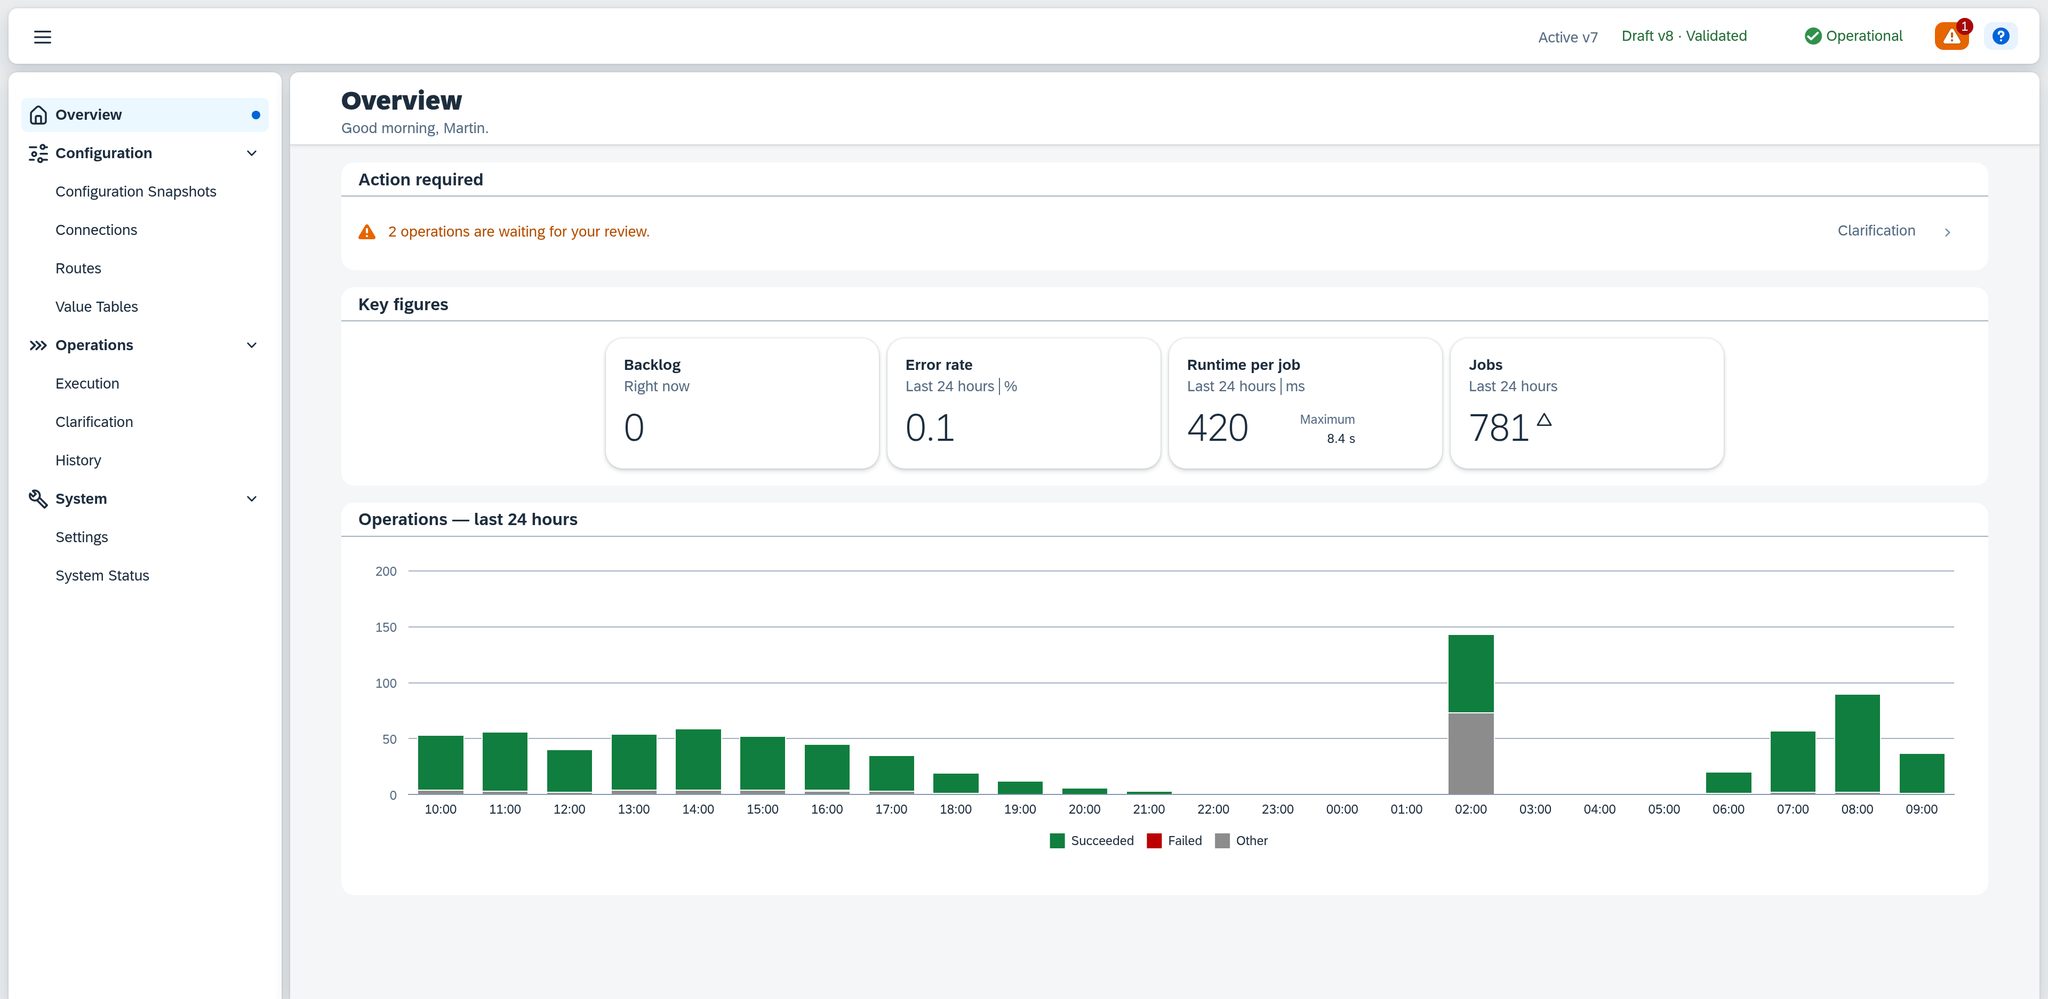
In the example: "Good morning, Martin." — M. Brandt logs in at 9:12 AM.
Nothing to clarify
The note on the right in the header. It appears only once Action required has been read and is empty; while the page is loading, it is still missing. Only the note confirms that nothing is open, and that in the section your permissions show.
Action required
A list, one row per matter. Each row carries an icon, a sentence in plain language and on the right the named jump to where the matter can be settled — System Status, Connections, Execution or Clarification. A click on the row goes there; a row that concerns a route opens this route on Execution.
Three urgencies, recognizable by icon and color: Error (red), Warning (orange) and Info (blue). Each row disappears as soon as its cause is resolved.
In the example: on October 8, 2026, at 9:12 AM the list carries exactly one row — 2 operations are waiting for your review., orange, with the jump Clarification.
The rows and their order
The list is sorted by urgency:
| Rank | Row | Urgency | Jump |
|---|---|---|---|
| 1 | the state of the system — stopped, unreachable, reset required | Error | System Status |
| 1 | the same place, but Maintenance mode is active — processing is paused. | Warning | System Status |
| 2 | connections that are blocked because of an access failure | Error | Connections |
| 3 | routes that are paused because of an error | Error | Execution |
| 4 | routes whose cleanup is suspended and waiting for release | Warning | Execution |
| 5 | jobs that are waiting for your clarification | Warning | Clarification |
| 6 | routes whose waiting events have not been processed for at least four hours | Warning | Execution |
| 7 | routes whose schedule has not triggered a run for some time | Info | Execution |
The state of the system is always at the top, no matter how urgent it is. Below it, color decides: first all red ones, then all orange ones, then the blue ones.
A row that concerns a route names the route's connection in parentheses after its name — e.g. Route "Artikel Cambira Austria" (Cambira Austria) …. Several routes can pass the same data to different systems, and only the connection says which one is meant.
When processing is stopped, the row names the reason in short form — e.g. Processing has stopped — Service Layer Out of Date. On System Status the same reason is given as a full sentence, together with what needs to be done.
A blocked connection leads to Connections. There, the connection itself shows why Xchange blocked it and what releases it again — see Connections.
The suspended cleanup points to a decision: Xchange intends to delete data, and is waiting for someone to release that. The decision is made on Execution. The row also says how long the wait has already lasted — in minutes up to an hour, then in hours, from two days on in days. In the first quarter of an hour the information is missing.
The blue row — Route "…" has processed nothing for …. — concerns only routes with a schedule. It appears when the schedule was due three times in a row and did not trigger a run, at the earliest after a quarter of an hour. A run that finds nothing to do counts as a run. The row therefore reports a schedule that no longer fires; a quiet source counts as fine with its empty runs.
The same action required at the top in the bar
The same list is behind the warning icon in the Xchange header bar, on every screen. The icon shows the number of rows, from 100 on as 99+, and it carries the color of the most urgent row — red, orange or, when only info rows are open, no warning color. Its tooltip reads, for one row, 1 item needs your attention., for several correspondingly in the plural. A click opens the list with the same jumps.
The icon appears only when there is something to report; when everything is settled, the header bar stays empty at this point.
In the example: the icon is orange and carries the 1 — one row, even though it reports two jobs.
Running now
One row per run that is working at this moment, the most recently created at the top:
| Part of the row | Content |
|---|---|
| Route | the name of the route |
| Connection and start | the route's connection, followed by since and the start time. If the run has not yet begun to work, it shows waiting since and the time it was created. |
| Run type | e.g. Full |
| Progress bar | how many jobs are processed and how many the run has in total. While the run is still reading records, the total can grow, and the label reads … of … so far; once the scope is fixed, … of …. |
| Pace line | the same line as in Execution: jobs per second or minute and, as soon as it can be foreseen, the expected end |
The bar grows while you watch. If the run finishes no job for a minute, the pace line turns orange and reads No job finished for a minute, then with the growing number of minutes.
A click on the row opens History, narrowed to this run.
What the bars leave open appears further down as Backlog — minus the jobs that are being processed at this moment. The backlog is therefore usually smaller than what the bars still have ahead of them together, and both numbers are correct.
The area appears only while a run is working. If it is missing, that is the normal case — most runs are done within seconds. In the example it is missing: at 9:12 AM no run is working. The last one of "Bestellungen Webshop" finished at 9:10 AM, the next one is due at 9:15 AM.
Suppose M. Brandt had mistakenly started a run with the run type Full for "Artikel Cambira Austria" at 9:10 AM: then at 9:12 AM this run would be shown here, with 318 of 1,186 jobs processed.

The key figures
Four tiles, in this order from the left: Backlog, Error rate, Runtime per job, Jobs.
Each tile carries its period below the number. There are two different ones:
- Right now — the state at this moment, without a comparison value.
- Last 24 hours — calculated over a rolling window that ends now.
| Tile | What it counts | Period |
|---|---|---|
| Backlog | jobs that are waiting for their processing or for a retry — without those currently being processed | Right now |
| Error rate | the share of the permanently failed among the completed jobs, to one decimal place | Last 24 hours |
| Runtime per job | how long a job takes | Last 24 hours |
| Jobs | how many jobs have run | Last 24 hours |
In the example, on October 8, 2026, at 9:12 AM: Backlog 0, Error rate 0.1 %, Runtime per job 420 ms with the maximum 8.4 s beside it, Jobs 781.
The arrow
The three window tiles compare the last 24 hours with the 24 before. They carry an arrow only when the value has moved by five percent or more — smaller fluctuations count as unchanged.
The arrow shows the direction, the color the assessment:
- For Error rate and Runtime per job, rising is orange and falling is green.
- For Jobs the arrow stays colorless. More traffic is neutral in itself.
- Backlog always stays without arrow and without color — a current state has no previous value to compare with, and a backlog is neutral in itself.
An arrow requires a value above zero in the window before.
How to read the four tiles
The error rate is calculated only over completed jobs: the permanently failed ones against these plus the successful ones. Skipped, waiting and currently running jobs stay out, as does one that was only submitted for review. Without completed jobs the tile shows a dash. In the example 673 successful and 1 permanently failed job result in 0.1 %; left out are the 106 skipped ones and the one review — together the 107 Other in the chart. The two clarifications of Action required are therefore on both sides of this calculation.
Backlog and open clarifications are two different things. In the backlog, jobs wait for their processing or the next attempt — Xchange gets further on its own. An open clarification waits for a person. Either of the two numbers can be zero while the other is high.
The large number of the runtime shows what almost all jobs have managed. From 20 measured jobs on, it is the value that 95 % of the jobs stayed under, and the single slowest one is shown beside it as Maximum; the tile's tooltip says the same. Both values choose their unit independently — in the example 420 ms and 8.4 s side by side, from one minute on composed like 1 min 12 s. With fewer than 20 jobs, the large number itself is the maximum; the tile says so below the number with Last 24 hours, maximum, and the space beside it stays empty.
An empty overview
If nothing has run in the last 24 hours, the three window tiles disappear and in their place is a sentence: No jobs in the last 24 hours. The Backlog still stays as long as it is greater than zero. If it is zero too, only the sentence remains.
The same tiles per route
Execution shows the same tiles for a single route, and there there are five: Open clarifications is added. On the overview, the open clarifications appear instead as a row in Action required.
Operations — last 24 hours
A column chart, one column per hour, 24 in all. A job counts in the hour in which it last changed its status. Each column is divided into three sections:
| Section | What counts in it |
|---|---|
| Succeeded (green) | jobs that ran through |
| Failed (red) | jobs that failed permanently |
| Other (gray) | everything else — skipped, waiting and currently running jobs and those that were submitted for review |
Other collects all jobs beyond the two clear answers. A job that was skipped because nothing changed is there just like one that is waiting for a decision.
The sections themselves carry only their color. The numbers are in the tooltip: point at a column, and it names the hour from which the column counts and how many jobs the section carries. The sum over the 24 hours is the Jobs tile above.
A click on a section opens History, narrowed to this hour and the section's status. This way you get from a conspicuous column straight to the jobs that make it up.
In the example: over the window from October 7, 9:12 AM to October 8, 9:12 AM, Failed carries exactly one job, on October 7 at 4:00 PM. Other carries 107. Everything else — 673 jobs — is Succeeded, and the highest column is on October 8 at 2:00 AM with 143. A click on the red section of the 4:00 PM column leads directly to the one failed job.
If nothing runs in the 24 hours, instead of the chart there is the sentence No operations in the last 24 hours. If there are no routes at all, the whole area disappears.
The banner above the screen
When processing is stopped or Xchange needs to be reset, a red banner with the reason and the link Check System Status lies over every screen. Which states carry a banner and which only a row in Action required is explained in System status and license.
What else applies
- The key figures count across all routes. A route that you never work on is included here with its jobs in the same number as your own.
- The page updates itself. You see that a run has finished or a row has been settled without reloading.
- Most runs find nothing to do and end with zero jobs. That is why the number of runs is far above the number of jobs, and that is why such a run stays invisible in the chart. Why a run without hits still counts as successful is explained in Execution.
See also
- Check whether a run went through cleanly (guide) — the morning round that starts here
- See how much goes through the interface (guide) — tiles and chart read together
- Wait or intervene? (guide) — what a row in Action required asks of you
- Stop a running run (guide) — when the wrong run appears under Running now
- Resolve a clarification (guide) — where the row of open clarifications leads
- Release or discard a suspended cleanup (guide) — the decision behind the row of a suspended cleanup
- Execution (reference) — the same key figures per route, and the place where you intervene
- History (reference) — the single job with its steps
- System Status (reference) — the reason for a stop as a full sentence
- System status and license (core concept) — what the states mean
- Permissions (core concept) — why two people see overviews of different length