Execution
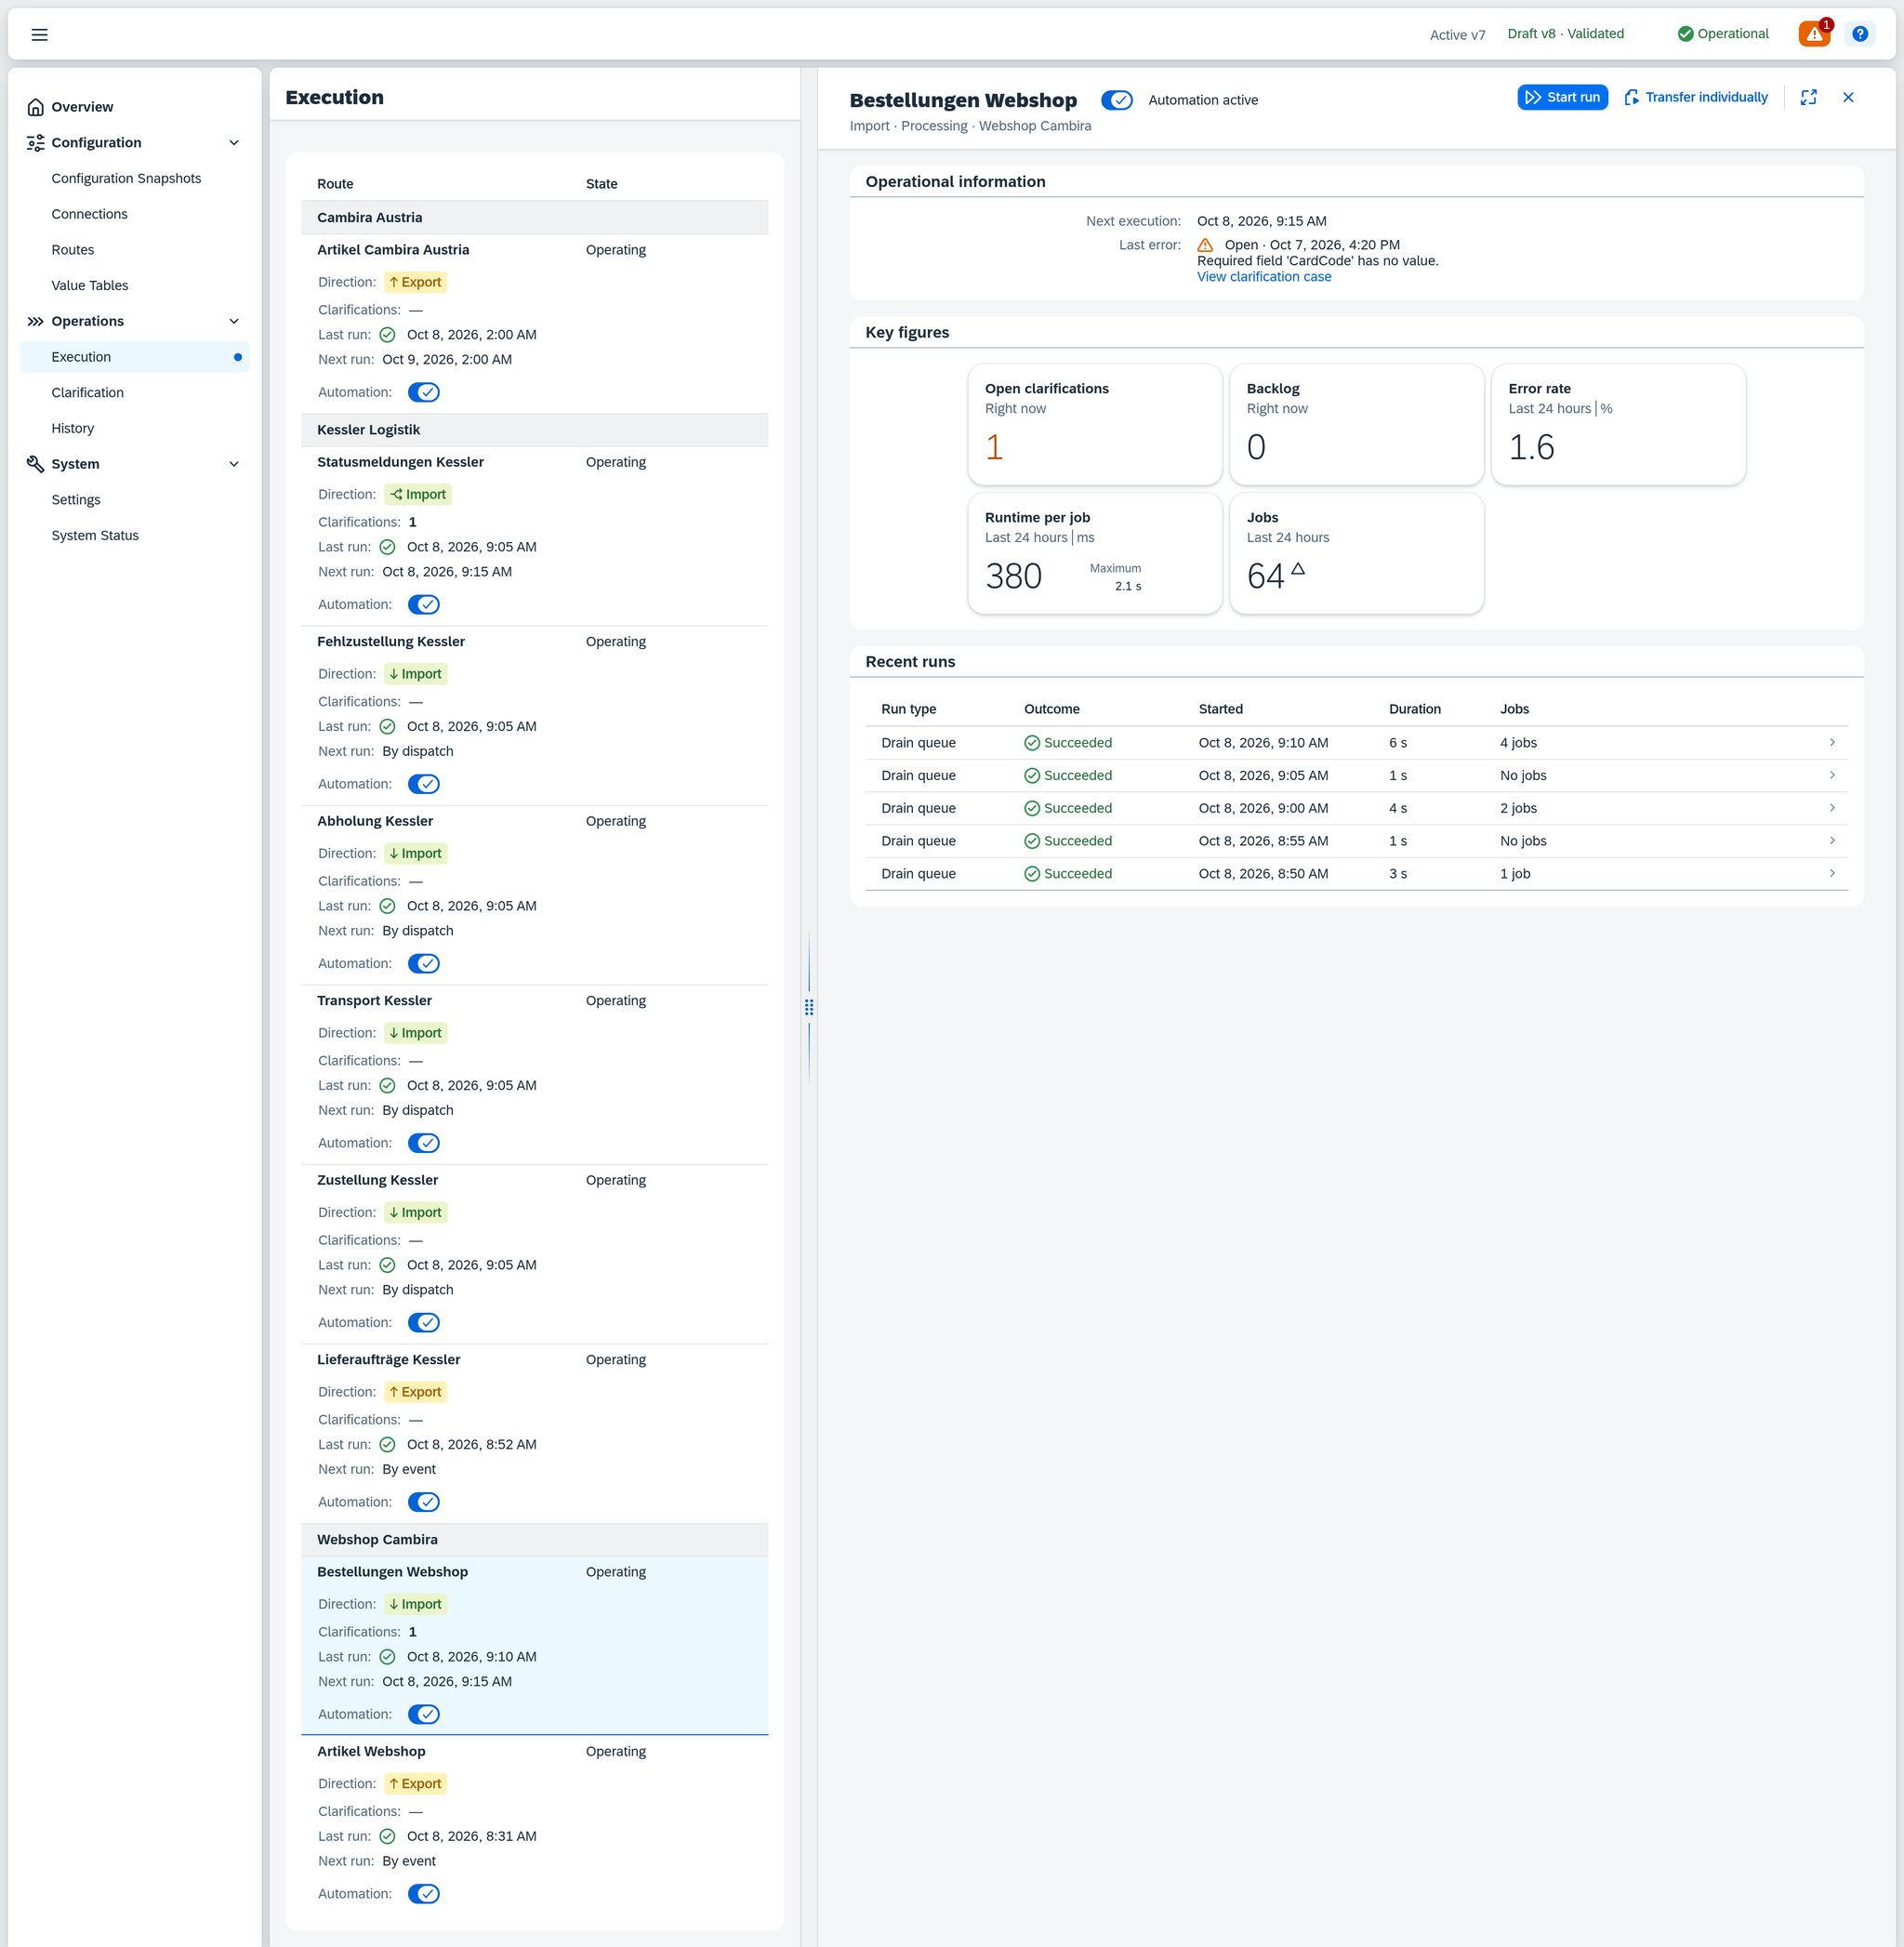
Execution is the screen for day-to-day operation. On the left are all routes of the active configuration snapshot with their state; on the right, for a selected route, you see what it is doing right now, what it did last and what is coming up next.
Setting up happens on the other screens. This one shows what has become of the configuration, and lets you intervene in operation — pause a route, start it by hand, decide on a cleanup that is on hold. How execution works is explained in the concept Execution.
Permissions
The screen follows the Execution permission:
| Level on Execution | What you can do here |
|---|---|
| None | the Execution menu item is hidden |
| Read only | view all routes, states, runs and key figures; Start run, Transfer individually, Cancel, Cancel all and Decide are hidden |
| Full | additionally start and cancel a run, transfer records individually, decide on a cleanup that is on hold |
Two things on this screen depend on a different permission. The automation switch — in the list and in the route header — and the Also pause the route checkbox when cancelling belong to the permission Automation. You can operate both only with it; without it the switch is grayed out and still shows the state. And the Open clarifications tile leads into Clarification, which brings its own permission.
Layout
| Area | What it shows |
|---|---|
| Route list (left) | all routes of the active configuration snapshot, grouped by their connection |
| Route header (top right) | name of the route, its automation switch with the state beside it, below that direction, kind of route and connection; on the right the buttons Start run and Transfer individually |
| Block strip | only when the automation is blocked: what blocked it — see Blocked automation |
| Operational information | what is running or waiting right now, the last error and the details of the next run |
| Key figures | five tiles over the last 24 hours — for this one route |
| Recent runs | the five most recent finished runs of the route |
The state beside the switch reads Automation active, Automation paused or Automation blocked. It separates what the switch alone does not: a pause someone put in place, and a block after an error.
The screen shows the active configuration snapshot. A route you are creating right now appears here only after activation. Without routes, the list says why:
| Title | Text |
|---|---|
| No active configuration | "Activate a configuration first so routes are available for execution." |
| No routes in the active configuration | The active snapshot contains no route; the text points to Configuration → Routes. |
If no route is selected on the left, the right side shows No route selected — "Select a route from the list to transfer records."
The route list
Seven columns, in this order:
| Column | Content |
|---|---|
| Route | the name of the route |
| Direction | whether the route fetches data, delivers it or transfers it within SAP Business One |
| State | the operating state of the route — see below |
| Clarifications | the number of open clarifications of this route; a number above zero is bold |
| Last run | start and outcome of the most recently started run. If one is active right now, it is that one — even one still waiting to be executed. The tooltip states how its jobs turned out. |
| Next run | the next scheduled point in time |
| Automation | one switch per route: whether its triggers take effect |
If a route is open on the right, only Route and State remain as columns on the left; the other details move as labeled lines below the route's name.
The routes stand below one band per connection. The internal routes have no connection; they stand below the band "SAP Business One", which always comes first. If the connection itself is blocked, the band says so at its right edge: Connection blocked. This affects all routes below it at once, and a run cannot be started then. The block is lifted on the connection, usually by a successful connection test. A connection cannot be paused — only the automation of a route.
State
Eight values. The first one from the top that applies wins — a paused route therefore never shows Operating.
| State | Meaning |
|---|---|
| Paused (fault) | A permanent error has blocked the automation. What to do is in the block strip on the right. |
| Cleanup on hold | A run is waiting for your decision about reported removals. |
| Overdue | The due time has passed without a scheduled run taking place. A run started by hand does not count; while a run occupies the route, it is not overdue. The tooltip states since when — No run for 40 minutes, No run for an hour, No run for 5 hours, from two days on in days. |
| Event backlog | Events are waiting and have not been processed for at least four hours. The tooltip states how long they have been waiting. |
| Never started | The route is active, but no run has taken place yet. |
| Paused (manual) | Someone switched off the automation of this route. |
| Operating | The route is working; this state applies when all the states above it are ruled out. |
| Cannot be determined | Determining the state failed. |
Paused (fault) and Paused (manual) look the same in the switch of the list. One goes back to an error, the other to a decision; the route header therefore shows Automation blocked or Automation paused beside it.
Only automation that is switched on is blocked. A route on Paused (manual) stays there, even when an error occurs — and Xchange does not switch it on by itself afterwards.
Last run
The start of the run, plus one of nine outcomes. Start means: the run began to work — not when it was created. A run that processes an event can be created and then wait, e.g. while its route is paused; its start is only the moment its first job is executed.
An active run comes before every completed one. Once it has started, the cell shows Running since and its start — even while it is paused because a retry is pending or the Service Layer is unreachable; the status icon says so. If it is still waiting to start, the cell shows Waiting since and the time it was created; the tooltip then also names the run executed most recently — Last executed: with start and outcome, or Never executed.
| Outcome | Meaning |
|---|---|
| Succeeded | No job failed permanently. This also applies to a run that read its data set and found nothing to do, and to one whose jobs were all skipped. |
| Partially succeeded | Some of the jobs failed permanently, others went through successfully. |
| Failed | Jobs failed permanently, and not a single one went through successfully. Skipped ones change nothing about this — the tooltip states how many there were. |
| Running | The run is running right now. |
| Pending | The run is queued and waiting to start. |
| Retry pending | The run has started and is waiting for its next attempt. |
| Interrupted — Service Layer unreachable | The run has started and stands still until the Service Layer is reachable again; it then continues on its own. |
| Cancelled | The run was cancelled. What was transferred up to then stays transferred. |
| Cancel requested | The cancellation has been requested, and the run is stopping. |
The outcome says only whether the run's jobs got through. Where a reason stands next to it, it is a separate detail: Failed · Records awaiting clarification. Most reasons belong to a run that ends before a single job is created — the reason is then the only place that says why. A run with permanently failed jobs always carries a reason, whether Failed or Partially succeeded. Sorted by what you check:
The configuration
| Reason | Meaning |
|---|---|
| Configuration cannot run | The route describes no data scope that a run could read, e.g. because its filter cannot be evaluated — or a stored content of the route cannot be read. In the second case the route is blocked as well (Paused (fault)), and the block strip names the content that has to be replaced. |
| No active configuration | No configuration snapshot is active — see Configuration Snapshots. |
| Route not in the active configuration | The active configuration snapshot does not contain the route. |
| Configuration removed during the run | The route or its connection was deleted before the run had finished. |
| Route paused | The route was paused after the run had started and before it created a job. If it is already paused at the start, no run is created at all. |
| Change filter does not allow an incremental run | The route's change filter contains no field, or one of its fields is not a date or number field directly on the record. This happens, for example, when the connection was switched after activation from Source returns a change token to another option under Detect changes — only the change token works without a change filter. The run ends before it reads any data. |
The connection
| Reason | Meaning |
|---|---|
| Connection blocked | The route's connection was blocked after the run had started. You lift the block on the connection. |
| Connection credentials rejected | The source system rejected the credentials. Xchange then blocks the connection. |
| Connection does not match the response | The external system's answer does not have the structure that the connection describes under Batch fetch. |
| Connection does not allow an incremental run | The connection was changed after activation so that it can no longer carry an incremental run — it pages by Page number or Offset without a sort, or the option under Detect changes lacks details. The run ends instead of skipping records. |
The source system
| Reason | Meaning |
|---|---|
| Source system rejected the query | The source system rejected the query, and a repetition does not change that. |
| Source system unreachable | Several attempts to read the source system failed because it did not answer. |
| Retrieval failed | Several attempts to retrieve the data failed with an error that cannot be traced to a specific cause. If only the Service Layer is down, the run does not end: retrieval waits until it is reachable again and spends no attempt meanwhile. |
| Source system keeps throttling | The source system asked to wait for a whole day without letting a single query through. Waits spend no attempts; only this bound ends the run. |
| Incoming events unreadable | Several attempts to read the route's waiting events failed. |
| Source system read position does not advance | The source system returns the same next page token over and over when paging. The run ends instead of reading the same page endlessly. |
| Read position discarded by the source system — full run follows | The source system no longer knows the remembered read position. A new run reads the data from the start; there is nothing to do. |
| Source system discards the read position repeatedly | The full run that followed lost its read position as well. Check the source system. |
| Source system rejected the acknowledgment | The jobs were processed, but the source system permanently rejected the confirmation — see Fetch from a queue and acknowledge. |
| Message without a message ID | A message fetched from the queue carries no Message ID; the messages stay in the queue, and the automation is blocked — see Fetch from a queue and acknowledge. |
The run itself
| Reason | Meaning |
|---|---|
| Records awaiting clarification | Jobs of the run failed permanently. What they failed on is stated by each job itself in History and in Clarification. |
| Run repeatedly aborted without a result | Several attempts of the run ended without a result, e.g. because the service restarted in between. |
| Technical fault | The run was started but never fully set up, e.g. because the database was briefly unreachable. There is nothing to do; a later run processes whatever was left open. |
Everything else is shown elsewhere: that a cleanup is waiting for your decision is shown by the route's State; how an individual job turned out — skipped, awaiting clarification — is shown by History; and that a scheduled run was dropped because one was already running is shown by the Missed executions line in the operational information.
The rule by which one of these outcomes follows from a run's jobs is explained under Execution.
How the jobs of this run turned out is stated by the tooltip over the entry — after the outcome, joined with middle dots: Succeeded — 1 for review · 16 ok. Where the run carries a reason, it follows the outcome as it does on the right: Failed · Records awaiting clarification — 7 awaiting clarification · 15 skipped. The results carry the same names and come in the same order as in the recent runs on the right (see below) — except that the tooltip writes ok where the right says succeeded, and leaves out cancelled jobs.
The column cannot be added up to daily figures. It shows exactly one run per route, and most routes run hundreds of times a day. What ran in total on a day is in the key figures and in History.
Next run
If there is a schedule behind it, a point in time is shown there. Otherwise the column names what the route waits for instead: By event or By dispatch. If the route is triggered only by hand or no point in time can be derived from its schedule, the cell shows "–"; what exactly applies is stated by the Next execution line in the operational information.
Blocked automation
If a permanent error has blocked the route's automation, a warning strip stands above the operational information. It states what caused the block and what to do, and carries the link Open route, which opens the route in the configuration — that is where each of these errors is fixed.
| Strip | Cause |
|---|---|
| "Fetching from the source system failed permanently — automation is blocked. Check the route's "Fetch endpoint" and the connection, then switch automation back on." | The route's fetch fails permanently. |
| "Acknowledging the fetched messages failed permanently — automation is blocked. Check the route's "Acknowledgment endpoint", then switch automation back on." | The source system permanently rejects the acknowledgment. |
| "A fetched message has no message ID — automation is blocked and the messages stay in the queue. Check the route's "Message ID", then switch automation back on." | A message from the queue carries no ID. |
| "A filter condition states no type — automation is blocked. Give the marked conditions a type, then switch automation back on." | A condition of the filter lacks its type. |
| "The type of a filter condition changed in the source schema — automation is blocked. Adopt the new type on the marked conditions. Once the types match again, the system lifts this block itself within six hours." | The source schema carries a field of the filter with a different type. The only block that lifts itself. |
| "The stored content of 0 cannot be read — automation is blocked. Replace the content, then switch automation back on." | A stored content of the route cannot be read; 0 is replaced by which one. |
| "Stored content of this route cannot be read — automation is blocked. Replace the marked content, then switch automation back on." | As before, when the content cannot be named. |
Operational information
The area shows only what currently applies to the route — in this order. If the route's runs could not be read, the strip "The runs could not be read." stands at the very top; Running now and Waiting are then missing, which does not mean that nothing is running.
Cleanup on hold
If a run has found more removals than it would report without asking, a strip Cleanup on hold appears here with both numbers — how many records were no longer delivered, out of how many transferred in total — and the Decide button. Behind it are two ways: Release reports the removals to the target system, Discard leaves the target system as it is. After discarding, the next full run puts the same question again.
If it has already been discarded before, the strip says so. Below it, it then states how often, when last and by whom — for several times the line begins with Already discarded 2 times, followed by the date and user of the last discard. If there was no earlier discard, the line is missing. It is the only place where you can see that someone has already decided here — the same question otherwise comes back unchanged.
In the example, the strip appears on no route. The Sunday run of "Artikel Cambira Austria"
found exactly one removal — ERS-2087 had been moved to item group 104 Auslaufartikel and so
dropped out of the data filter. One is below the threshold, so Xchange reported the item without asking.
How to choose between releasing and discarding: Release or discard a suspended cleanup.
Running now
A route can have several runs at the same time. For each run, the run type is shown, how long it has been running, and a progress bar, labeled e.g. 312 of 840 jobs. While the run is still creating jobs, the total keeps growing, and the label reads 312 of 840 jobs so far. In addition, every line carries Cancel and Show in History. If nothing is running, the section is missing. From five runs on, the list shows the first five; More reveals the rest.
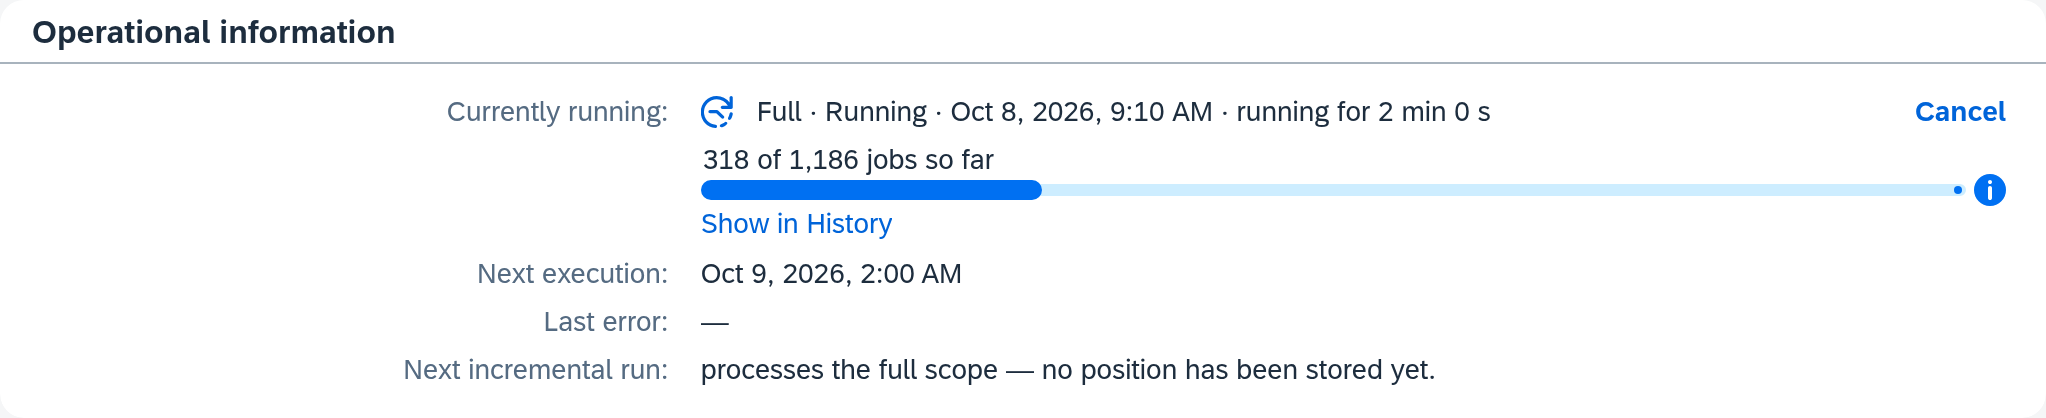
If the run has to wait for a new retrieval attempt, a line of its own says so. It names the coming attempt, the maximum, the point in time and the time left — Data retrieval waiting · attempt … of … on …; for a run with the outcome Retry pending it begins with Retry scheduled. Below it stands the reason, e.g. Source system unreachable; the info icon beside it opens the source system's response as it arrived. If retrieval is only waiting for the Service Layer, the line reads Retrieval is waiting for the Service Layer — that costs no attempt.
Below the bar, a line shows how fast the run is progressing, e.g. ≈ 11.4 jobs/s · expected to finish around 19:02 (about 4 h left). The line appears once the run has worked for a minute and finished a few jobs. The expected end is added only once all of the run's jobs have been queued — until then only the pace shows. If no job has finished for a minute, the line gives way to a notice, e.g. No job finished for 3 minutes. As long as the Service Layer is unreachable, the line is missing entirely; afterwards the minute only counts from its return.
If the service or the Service Layer was unavailable during the run, that time does not count. Instead of running for …, the line then reads e.g. active 18 min 40 s · interrupted 42 min 5 s — the time the run worked, and the time it stood still.
As long as the run is still searching the data set and has not created a job, the line Determining data… stands in place of the bar. With the first job, the bar takes the line's place. The so far disappears from its label once all of the run's jobs have been queued — the same moment the pace line adds the expected end.
Waiting
Runs that are queued and still waiting to start. If none is waiting, the section is missing. As under Running now, individually listed runs from five on are behind More.
Runs of the same kind share one line. What is combined is what has not yet finished a single job — separated by run type and by whether the group is waiting or already being cancelled. The line states the run type, the quantity and the age of the oldest, e.g. Incremental · 3 items · waiting for 4 min 10 s. A waiting run that already has jobs behind it, by contrast, stands on its own — in the same line form as under Running now, except that it shows Waiting since and the time it was created.
The quantity is given in items only when it is known for every run of the group, otherwise in runs. A group that is already being cancelled always counts in runs and carries Cancel requested after it.
Every combined line leads through Show in History into History. As long as there is something to cancel, Cancel all stands next to it — it ends the runs of this one line.
Next execution
The line is always there. With a schedule it names the next scheduled point in time; otherwise it says what triggers the route. If the automation is paused, it is given in the conditional:
| Trigger | Automation on | Automation paused |
|---|---|---|
| Schedule | the point in time | "Would be 0", e.g. Would be Oct 9, 2026, 2:00 AM |
| Event | "Is triggered by an event" | "Would be triggered by an event" |
| Dispatch route | "Is triggered through a dispatch input" | "Would be triggered through a dispatch input" |
| Schedule without a derivable point in time | "Runs on a schedule — but no next execution can be derived. Check the schedule." | "Would run on a schedule — but no next execution can be derived. Check the schedule." |
| By hand only | "Runs only manually" | "Runs only manually" |
You set up the triggers themselves under Routes — Automation.
Missed executions
Appears only when some were dropped: scheduled executions that were skipped because at their time a run of this route was already working that does not allow a second one beside it. The line states their number, for several the time of the last one, and ends with the run that is holding them up — e.g. 3, most recently at Oct 4, 2026, 5:00 AM — the run from Oct 4, 2026, 3:00 AM is still active.
Above an upper limit, the number is a minimum. The line then begins with Over and leaves out the last point in time, because it can then no longer be determined.
As soon as the run holding them up is finished, the line disappears.
Incoming events
Only for event-driven routes and only when something is waiting. The line states how many events are waiting and since when the oldest has been waiting, followed by the reason: Connection blocked, Retrying or Processing stalled. The link Show events opens the list of these events — see Waiting events.
Last error
The state of the clarification case and the time of the most recently failed job, below it its message and the link View clarification case, which opens this case in Clarification. In the example, "Bestellungen Webshop" shows Open · Oct 7, 2026, 4:20 PM. If there is none, the line shows "–". An error that Xchange is still retrying has no clarification case and does not appear here.
Next incremental run
Says where the next incremental run starts: per field of the
change filter, a line with the largest value the last
incremental run read in it — reads UpdateDate from Oct 7, 2026 onwards, below it the same line
for CreateDate. The tooltip says: "Incremental runs read, per change field, every record whose
value is at least the one shown. For points in time the run starts five minutes earlier, so changes
saved at the same moment are not lost." A field like UpdateDate, which SAP Business One keeps to
the day only, is therefore read again from that day by the next run.
The line can take two other forms:
| Text | Meaning |
|---|---|
| "processes the full scope — no position has been stored yet." | No run with a change filter has completed successfully yet, e.g. right after activation. From then on every successful incremental or full run leaves a position. |
| resumes at the position stored on Oct 7, 2026 | The connection reads changes through a change token, and Xchange remembers the last one delivered; the date says when it was stored. Without that date the line reads "resumes at the stored position". |
The key figures
Five tiles over the last 24 hours: Open clarifications, Backlog, Error rate, Runtime per job, Jobs. The same tiles appear on the Overview — there for the whole system, here for this one route. There are four there; the open clarifications appear there under Action required. What each tile counts and how to read its comparison value is explained on the overview.
The Open clarifications tile can be clicked. It opens Clarification, narrowed to this route. If it shows more than zero, the number is orange.
Recent runs
A table with five columns — Run type, Outcome, Started, Duration, Jobs. It shows the five most recent finished runs of the route — regardless of run type. A nightly full synchronization has therefore disappeared from the table by the next morning as soon as five short runs have taken place since. You find older runs in History. A run that is working right now appears under Running now.
The Start column shows the start of the run; when it was created is in the tooltip — Created …. If a run ended without ever working, e.g. because it was cancelled while it was waiting, the cell shows "–" and the tooltip says Created …, not started.
The Duration column shows the time the run worked. If the service or the Service Layer was unavailable in between, that time is not included; it appears as a second line below, e.g. interrupted · 42 min 5 s, and the tooltip says The service or the Service Layer was unavailable.
The Jobs column states the number. If all went through successfully, the number stands alone — 4 jobs; otherwise the breakdown follows in the finer wording, e.g. 17 jobs: 1 for review, 16 succeeded. If a run had not a single job, it shows No jobs.
The results always appear in the same order — first the ones that require intervention:
| Result | What it means |
|---|---|
| awaiting clarification | The job failed permanently and is in Clarification. |
| blocked | Something the job builds on failed permanently; it therefore stopped before it began. |
| for review | The job was submitted for review and is waiting for a decision. |
| succeeded | The record has arrived on the other side. |
| skipped | There was nothing to do for this record. |
| cancelled | The job was cancelled. |
A click on a row opens History, filtered to this one run. How to go through a run from there: Check whether a run went through cleanly.
The actions
Start run
Opens a dialog. Whether there is anything to choose in it at all depends on the route's source. A fetching route whose source allows changes to be detected offers the Run type Full or Incremental — Incremental is preselected. If only one run type remains, the selection is omitted and a confirmation sentence takes its place: "Start a full run for this route now?" for a fetching route without change detection, "Empty the queue for this route now?" for a queue route.
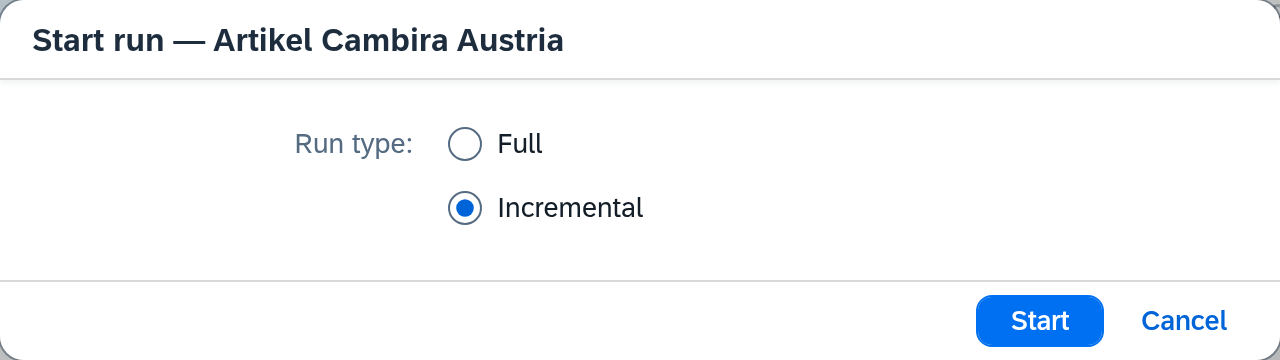
If only the full run remains, the dialog states the reason below the confirmation sentence:
| Sentence | What is missing |
|---|---|
| "This route does not fetch from an endpoint, so it has no incremental run." | The route reads no data set. |
| "Incremental runs become possible once the route's change filter contains at least one field." | A valid change filter on the route. |
| "The connection lacks details for the chosen change detection. Complete them on the connection to make incremental runs possible." | The details of the option under Detect changes on the connection. |
| "The connection does not read in sorted order. Set up a sort on the connection to make incremental runs possible." | Sort on the connection. |
| "The source connection of this route cannot be read or no longer exists. Check the route's connection." | A readable connection of the route. |
For a queue route you can enter an upper limit under Limit to; if the field stays empty, the whole queue is emptied. For a full run you can switch on the Cleanup: Report records no longer delivered.
A manual start also works with the automation paused. The run does not start, however, if the route's connection is blocked or if a run has already been requested. If Xchange refuses the start, a short message says why:
| Message | Cause |
|---|---|
| "A run for this route is already requested" | A run of this route is already working or waiting. |
| "The route's connection is blocked" | The connection is blocked. |
| "The license is not valid — new runs are blocked" | The license permits no run. |
| "The system is not ready for new runs yet" | Xchange is not ready for operation. |
| "This route only reacts to events — there is no data scope to run" | The route has nothing a run could read. |
| "The route's change filter contains no field — an incremental run is not possible" | The change filter is empty. |
| "This route does not fetch from an endpoint — an incremental run is not possible" | The route reads no data set. |
| "The connection lacks details for the chosen change detection — an incremental run is not possible" | On the connection, the change detection was changed or one of its details cleared while the dialog was open. |
| "The connection does not read in sorted order — an incremental run is not possible" | The Sort was cleared on the connection while the dialog was open. |
| "The route's source connection cannot be read — an incremental run is not possible" | The route's connection cannot be read. |
| "The run could not be started" | Another reason. |
The incremental messages appear when the situation changed between opening the dialog and Start — before that, the dialog would not have offered Incremental.
If a running run rules out every run type the dialog would offer, the dialog stays closed — the message appears immediately instead. If even one remains possible, the dialog opens; a refusal can then still come at the start.
For a route supplied by a dispatch route, the button is missing. Its data comes from the dispatch route — start there.
When a manual start is the right move: Push manually — a run or a single record.
Cancel
Ends a running or waiting run. The dialog says what that means: queued jobs are dropped, running ones are stopped, records already transferred remain.
The dialog has two forms. If the cancellation applies to a single run, it is called Cancel run, and so is its button. If it comes through Cancel all on a combined line, it is called Cancel waiting runs, states the number of runs affected below that and ends with Cancel runs.
If the route's automation is on, the dialog contains the Also pause the route checkbox, already checked, with the note on when the automation would otherwise start the next execution. Without the check mark, the automation starts the next run at that time. When a cancellation is worth it: Stop a running run.
Transfer individually
Transfers individual records named explicitly — for the case where exactly three items are missing on the other side and a full run would be too coarse for that.
The dialog offers up to three forms; which ones depends on the route. If it offers more than one, you choose between them at the top. Preselected is the form last used on this route, otherwise the strongest one offered.
| Form | Offered when | Input |
|---|---|---|
| Display value | a Display field is set in addition to the key and the source has a Fetch endpoint | values of the display field, one per line; the field is named after it, e.g. "Display values (DocNum)" |
| Key | the source has a Single-fetch endpoint and the route does not get its data from a queue — SAP Business One and REST alike | keys, one per line |
| Source record | always | one record as JSON; the only check is whether it is valid JSON |
For keys and display values the dialog counts along, removes duplicates before the transfer and takes at most one hundred lines.
A display value that Xchange cannot match to exactly one record is skipped. The line stays in the field with its reason, in the form "value — reason", and the dialog stays open and states the result, e.g. "2 of 3 records were transferred." If nothing was skipped, it closes.
| Reason | Meaning |
|---|---|
| not found | No record in the source has exactly this value. |
| several records, please enter as key | The value is not unique. |
| the source does not support searching by display value, please enter as key | The source did not narrow the search by the display field. |
| no permission to read in the source | The source refuses your user read access. |
| same record as another line | Another line already leads to this record; it is transferred once. |
Every form that transfers creates a run with the run type Targeted. A targeted run is never skipped. A full or incremental run tolerates no second one of its kind beside it — a targeted one does. So it starts even while the route is working.
A targeted run writes the source's state, even over a conflict. Where the route keeps a field in the target system or submits it for review, the top of the dialog therefore reads: Transferring individually writes the source's state — this route's conflict rules do not apply. The rules are under Routes — Behavior. When to transfer individually instead of starting a run: Push manually — a run or a single record.
Pausing and resuming automation
The switch in the list and in the route header. It stops the triggers of this one route — schedules rest, events accumulate. For a dispatch route, Xchange asks first, because with it the supply of all target routes stops too.
If events are waiting when you switch it on, a dialog opens first. It is called Switch on automation and shows what has accumulated during the pause — see below. If nothing is waiting, the switch flips without asking.
A pause leaves the configuration as it is — as does a cancelled run or a discarded cleanup. These are operating decisions; they apply until they are reversed. Whether to pause or wait: Wait or intervene?; if the route is to rest for good: Take a route out of operation.
Waiting events
The dialog lists the events that have accumulated for a route and have not been transmitted yet. You reach it in two ways, and its form follows from that:
| Way | Title | Buttons |
|---|---|---|
| Show events in the operational information | Waiting events — Artikel Webshop | Discard selection, Discard all, Close |
| Switching on the automation | Switch on automation — Artikel Webshop | Discard selection, Discard all and switch on, Switch on, Cancel |
When you switch on, the text above the table says how many events are waiting — e.g. 3 events are waiting for this route. Switching on transmits them. If the connection is blocked, it says The connection is blocked. The events are transmitted once the block is lifted. instead.
The table has three columns — Key, Event type, Received — and shows the oldest event first. By Key and Received it can be re-sorted through the menu in the column header. It shows 100 events at first and loads the next ones as you scroll. If nothing is waiting, it reads No events are waiting.
While the dialog is open, the list stays put. If the number of waiting events changes, a note appears above the table — e.g. New events have arrived: 4 events now. or Events have since been processed or discarded: 2 events now. Only Refresh reloads the list; newly arrived events then appear highlighted, and your marked rows stay marked.
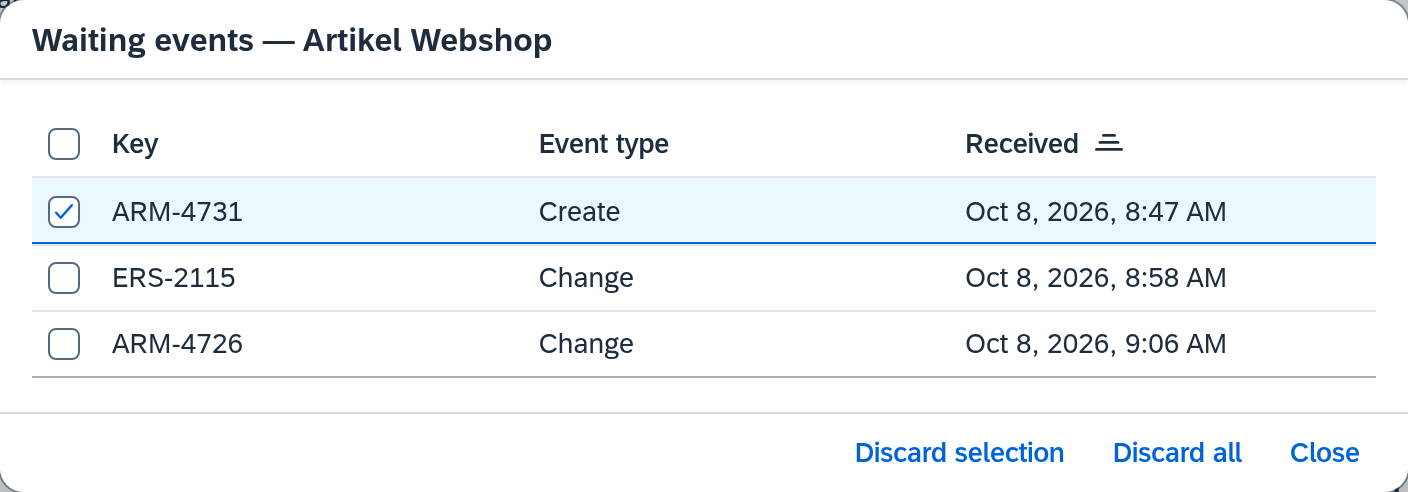
Discarding means: not transmitting. The selected events are dropped without a run being created. Xchange asks first — Discard events?, with the note This cannot be undone. Discard all means all events received up to the moment the list was loaded, including those not yet loaded by scrolling; the confirmation therefore names their number and when the newest loaded event was received. The discard buttons appear only with the Automation permission at Full; Discard selection only once you have marked rows.
Three cases in which the dialog stops you:
| Message | Occasion |
|---|---|
| One more event has arrived. Check the list and choose again. | With Discard all: an event has come in since the list was loaded. |
| This route's events are being processed right now. Try again in a moment. | The route is working through these events right now. |
| The events could not be discarded. Try again. | Discarding failed. |
In the first case, the dialog reloads the list; nothing has been discarded yet.
After discarding, a short message says how many events were discarded and how many had already been processed. If discarding fails while switching on, the automation stays off — the message then says so explicitly.
See also
- Fetch from a queue and acknowledge (guide) — what to do when an acknowledgment is blocked
- Check whether a run went through cleanly (guide) — following a run from here down to the individual job
- Wait or intervene? (guide) — when a state calls for intervention
- Stop a running run (guide) — cancelling with and without a pause
- Push manually — a run or a single record (guide) — Start run and Transfer individually in use
- Release or discard a suspended cleanup (guide) — the decision behind Decide
- Take a route out of operation (guide) — letting a route rest for good
- Overview (reference) — the same key figures for the whole system, and explained there
- Routes — Automation (reference) — the triggers that take effect here or are paused
- History (reference) — the individual job with its steps
- Execution (core concept) — run versus job, retry, why a cleanup waits