See how much goes through the interface
A week after the start, someone asks: "Is the thing you built actually working?" What is meant is rarely a single transfer — what is meant is whether the whole thing holds up. How much goes through, how often does something go wrong, how long does it take, is anything backing up.
Xchange answers this in three places, and they build on one another: how much is on the Overview, when in the hourly chart below it, which route only on Execution. This round takes two minutes and changes nothing.
What you need
- For the Overview's figures, the History permission, level Read only. Only with it does the Overview show the tiles and the hourly chart (see Permissions).
- For the third step, additionally Execution, also Read only.
- Entry point: the Overview menu item.
All figures on this page refer to the last 24 hours, counted from now. The window moves along — two hours later, it is a different 24 hours.
1. The four figures of the day
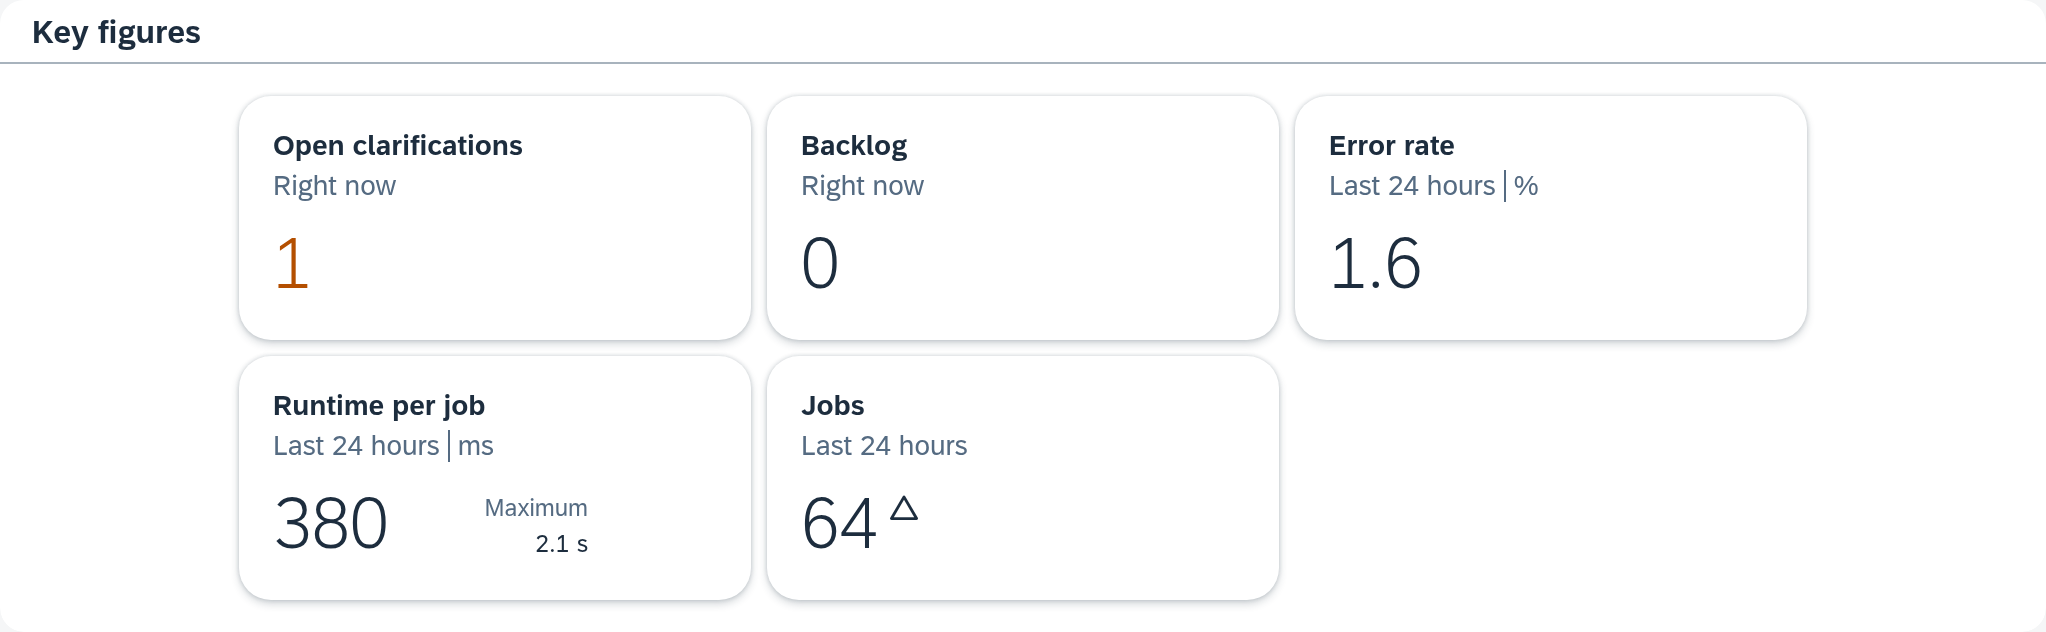
The tiles are in the middle of the Overview. Read them from left to right, in the order in which they appear.
In the example, on Thursday, October 8, 2026, at 9:12 AM: Backlog 0, Error rate 0.1%, Runtime per job 420 ms with 8.4 s as the Maximum next to it, Jobs 781. This turns into a sentence you can pass on:
In the last 24 hours, 781 jobs ran. One failed and is in clarification, nothing else. Nothing is backing up, and the runtimes are unchanged.

Two things you need when putting it into words. The yardstick for a figure is provided by the arrow: it relates the figure to the same 24 hours before. An error rate with no arrow next to it is the more reassuring answer than a low one with an orange arrow. And the open clarifications are at the top under Action required, separate from these four figures. What counts in which tile is listed in the Overview — look there when a figure deviates from your expectation.
2. When it happened
Below is the bar chart Operations — last 24 hours, one bar per hour. It turns a daily total into a daily course, and that is often the more useful answer.
In the example, two rhythms lie on top of each other. The highest bar is on October 8 at 2:00 AM with 143 jobs — that is a single nightly run that delivers its whole volume at once. A good half of it is gray, that is, Other: jobs that were skipped because there was nothing to do for them. The remaining 638 spread over the other 23 hours, most densely during the working day: routes that check every few minutes, and routes that wait for events and therefore run when someone is working.
The highest bar therefore does not carry the most load — it is only the one hour in which everything coincides. On its own, it makes the connection look like a night operation; in fact, the larger part lies in the day, only spread out. The one failed job, by contrast, gets lost: it is in the bar for October 7 at 4:00 PM, and one of around 45 is narrower there than a pixel. That it exists is reported by the Error rate tile with 0.1%; a click on the 16:00 bar leads to it.
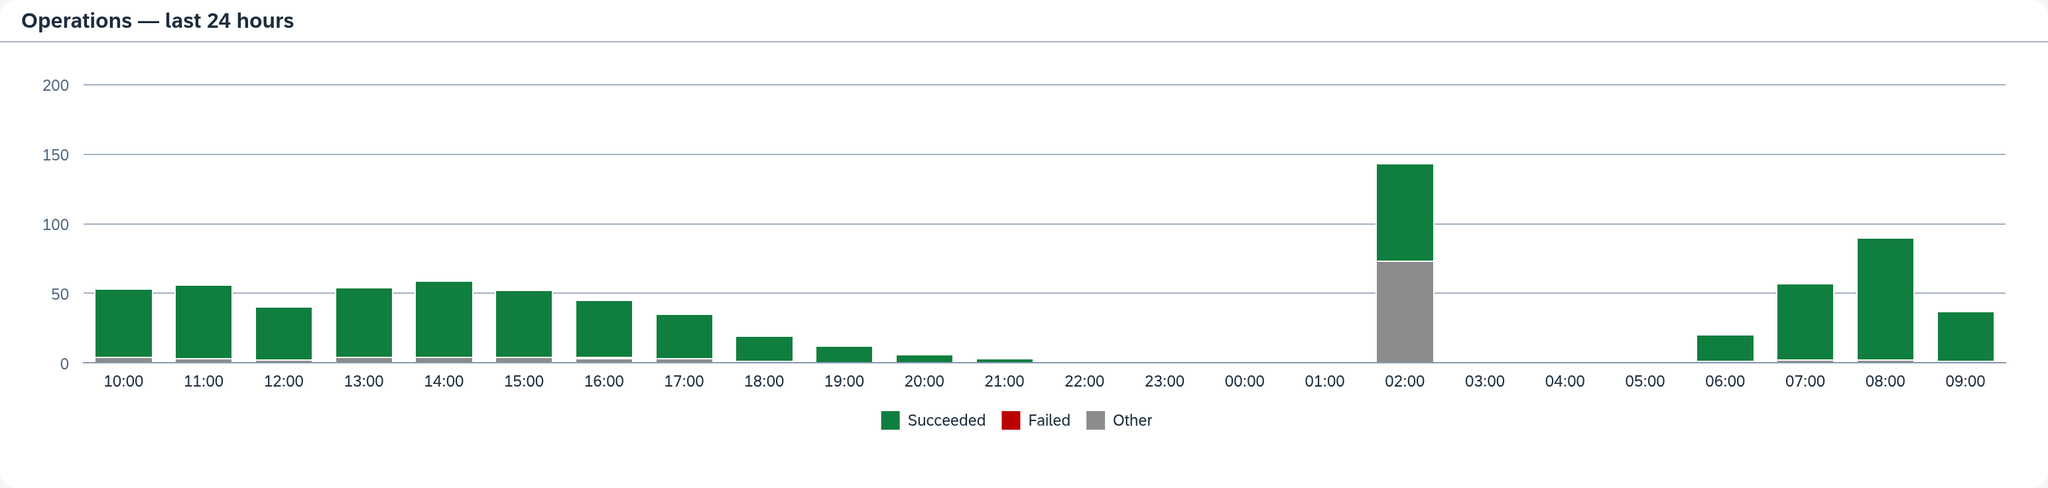
The chart shows the height of the bars. If you want to know what exactly was in an hour, click its bar: this opens the History, narrowed to this hour, with the jobs that make it up.
3. Which route it is
The Overview calculates over the whole system. Which route generates the traffic and where the error was is answered by Execution.
- Open Execution.
- Choose a route on the left.
- On the right are the same tiles as on the Overview, only for this one route — with a fifth, Open clarifications.
In the example, all nine routes contributed jobs, and very unevenly: "Bestellungen Webshop" runs every five minutes, that is, 288 times in the window, and carries 64 jobs in the process. "Artikel Cambira Austria" runs once, at night at 2:00 AM, and carries 143. How often a route runs is therefore a different question from how much goes over it.
You look at the routes one after another. If you want to know how the jobs are distributed across the routes, click through the routes in turn. With nine routes, that takes a minute.
4. Where these figures stop
- The tiles count all jobs in the window, the run lists show a selection. The Last run column shows exactly one run per route, the Recent runs table at most five. "Bestellungen Webshop" alone runs 288 times in the example — calculate with the tiles, not with the visible rows.
- The period is always 24 hours, rolling. The comparison the UI makes is the arrow against the 24 hours before.
- You record a value over the week yourself. Note down the figure you want to keep.
- For a single document, you go through the job yourself. "Our order is missing" is answered by the job, not by the error rate — see Find and trace a single job.
What comes next
If something stands out during this round — an arrow that was not there before, a route with a conspicuous error rate — the next step is the run itself: Check whether a run went through cleanly.
See also
- Overview (reference) — what each tile counts and what the arrow means
- Execution (reference) — the same tiles per route, and the place to intervene
- Execution (core concept) — why far more runs than jobs come about