It ran for months and stopped yesterday
The call comes from the business department: something is missing in the target system that should have been there long ago. And the sentence that comes with it is almost always the same — it ran for months, it stopped yesterday, and we did not change anything.
In the example: Monday, October 5, 2026, the route "Artikel Webshop" to the connection "Webshop Cambira". It transfers item changes as soon as they occur and has done so without incident since June. Since the morning, nothing has arrived in the shop.
What you need
- The permissions Execution and History, level Read only. With them, you can follow the whole chain below; only acting afterwards requires Full. For the counter-check at the end of the page, Configuration Snapshots and Routes are added, also read-only. See Permissions.
- The name of the route or at least that of the connection. The business department rarely names a route; they name the system in which something is missing. That is enough to start.
- A record where it was noticed — an item number, an order number. You only need it at the end, and with it the answer becomes concrete.
The order
Four questions. Each settles a whole branch before the next one would have to enter it:
- Is the route stopped? — then the answer lies with the route.
- Do the runs complete? — if they fail, the answer lies in the run.
- Do the jobs take effect? — if they remain without effect, the answer lies in a setting.
- Is something waiting for you? — then it is in Clarification and has a plain-language explanation there.
Go through them from top to bottom. If you start with the fourth, you may be looking for a clarification case while the route has been paused since yesterday.
Before that, a glance at the top edge of the screen is enough.
First: Is the whole system down?
If a colored strip lies across the screen, Xchange has halted processing — for all routes at once. Then the answer lies in the strip: it names the reason, and Check System Status leads to the place where it can be fixed.
One reason affects precisely the routes that react to changes in SAP Business One:
The event filters are out of date and need to be repaired. Until then, Xchange does not process any changes from SAP Business One.
This is how you fix it. You need the permission System at the level Full for this.
- Open System Status and, in the Operating state section, click Repair event filter.
- If Xchange reports Event filters repaired, the halt is resolved.
- If Xchange reports Correct the route, a route in the event filter refers to something that is missing in the field structure of the target. The message names the route and, where it is a single field, that field as well. Adjust the event filter of this route and activate the configuration. With the successful activation, the error is resolved. You can still configure during this halt.
Where the event filter of a route is located is shown in Routes — Automation. All other reasons are described in System Status.
In the example, the top edge of the screen is clear. On to question 1.
Is the route stopped?
Open Execution and read the State column in the route list.

| What it says | What it means | Where to go next |
|---|---|---|
| Paused (fault) | A permanent error has locked the automation. Since then, the route has been resting — deliberately. | The notice strip on the right names the reason. Then: Resolve a clarification. |
| Paused (manual) | Someone switched off the automation. That is a decision — perhaps a forgotten one. | Take a route out of operation describes both directions. |
| Overdue | The time has passed, and the due run is still pending. The tooltip says since when — e.g. No run for 26 hours. | On to question 2 — the last run tells you why the due one failed. |
| Event backlog | Events are there and are piling up. | On to question 2. The reason for the backlog is given in the Operational information under Incoming events. |
| Never started | The route is active and waiting for its first run. For a route that ran for months, you are then looking at a different one. | Check the name and connection. |
| Operating | The route is working. The absence has a different reason. | On to question 2. |
The two Paused values look the same in the switch and mean opposite things: one is a defect, the other your decision. Only the state text tells them apart.
In the example: "Artikel Webshop" shows Operating. Runs are taking place — so the whole first branch is settled.
Do the runs complete?
The same row, the Last run column: the time and, in front of it, a symbol for the outcome. The tooltip of the symbol gives the wording of the outcome.
First, the time. If it lies far back although the route is supposed to run every hour, the question is: Why is the run not happening? For that, Next execution in the Operational information is responsible. If the automation is paused, a time in the conditional appears there: Would be Oct 9, 2026, 2:00 AM. The time says when the run would be if the automation were running.
Then the outcome. Two symbols matter here:
- Red cross, Failed — the run itself failed, or every single one of its jobs.
- Orange warning sign, Partially succeeded — part failed, the rest succeeded. What is missing is a subset with a common characteristic.
Select the route. In its Operational information, Recent runs lists the last runs with their Outcome. If it says Failed · Configuration cannot run, the configuration stopped the run before it started. Then something did change after all; Change a running configuration shows where.
If a job has failed, the Operational information also shows Last error: in the header, whether the clarification case is open and when the error occurred, below it the message of the most recently failed job and the link View clarification case. That is the fastest way to the cause.

In the example: in front of Oct 5, 2026, 6:12 AM is the red cross, and the tooltip says Failed. Under Last error is the message — and it comes from the shop:
400 Bad Request – field "taxClass" is required
With that, the cause is essentially found. What the chain still does is described under "But we did not change anything".
What a single run tells as a whole — jobs, steps, times — is described under Check whether a run went through cleanly; by which rule the jobs of a run turn into one of the outcomes, under Execution.
Do the jobs take effect?
Here everything looks green: the route runs, the runs succeed — and yet something is missing in the target. Then jobs have been created that remained without effect.
Open History, filter on the route and look at the Status column. For comparison, an ordinary hour of "Artikel Webshop", on Thursday, October 8, 2026, from 8:12 to 9:12 AM:
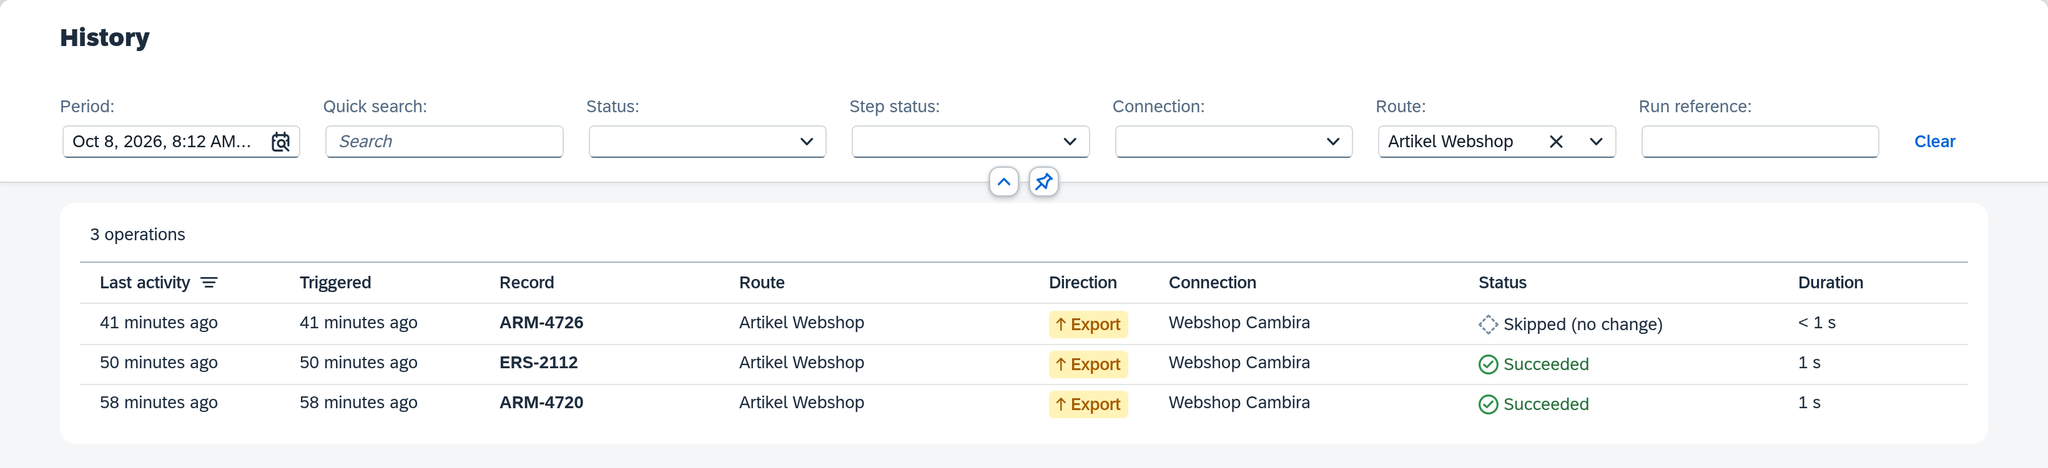
On ARM-4726, purchasing changed only the supplier note at 8:31, a field outside
the mapping. The content for the shop stayed the same, so Xchange skipped the write.
| Status | What it means |
|---|---|
| Skipped (no change) | The content is the same as at the last write, and the record has not changed in the target system since. Xchange saves itself the second write. |
| Skipped (condition) | A condition of the route sorted out the job. |
Both are intended outcomes. If Skipped (no change) appears en masse, everything in the source system is as it was — what is missing in the target was already missing before and stays missing until you push it. The way there is Push manually; why an incremental run only takes changes along is described under Transfer only changes.
If it says Skipped (condition), the record is excluded by a data filter — deliberately left out. Whether rightly so, you decide on the filter itself: Narrow down with a data filter.
And if History stays empty for this route? Then simply nothing has arrived at Xchange. That is the branch that leads out of Xchange — see Where the cause lies outside.
Is something waiting for you?
This question answers itself in seconds, but only for cases that the three questions before it have left over.
On the Overview is Action required — a list, one row per matter, sorted by urgency. If there are open clarifications, a row such as 2 operations are waiting for your review. appears there, with the jump into Clarification. The same list is behind the warning symbol in the header bar, on every screen.
In Clarification, each case names its Cause in plain language, plus one of six cause groups. The group tells you in one word where the problem lies — Configuration, Source data, Target system, Connectivity, Internal error or For decision.
Pay attention to the group hint above the Cause area. If there are two or more open cases with the same cause on the same route, it appears there, with the count. That is the difference between a single case and a disruption — and the number also answers the business department's question of whether only their item is affected.
From here, continue with Resolve a clarification, and if there are many of the same kind, with Retry failed jobs.
In the example: by 1:40 PM there are 31 cases, each a different item, all with the same cause Target system rejected from the group Target system. They do not block each other: an open error holds back only the same record; the route keeps running for all others.
What resolves itself
Before you intervene, take a look at the Duration in History: for a job with several attempts, it shows both — the duration and the number of Attempts.
An Attempts: 2 is the trace of a disruption that Xchange has already dealt with. Temporary errors — the target system briefly does not respond, the connection drops — are retried by Xchange by itself. Such jobs appear only in History.
In the example: the evening before, Sunday around 10 PM, the shop was unreachable for a few minutes because of an update. Three item exports failed, and all three went through on the second attempt. They are visible only in History, by Attempts: 2.
When waiting is worthwhile and when intervening is, is decided by Wait or intervene?.
"But we did not change anything"
The statement can be checked in two places. For this, you need the permissions Configuration Snapshots and Routes, each at the level Read only:
- Configuration Snapshots — when the active snapshot was activated. If that time lies before the start of the disruption, its cause lies outside the configuration.
- The Last modified column in the route list. It shows when something was last edited on this route.
In the example, both times are old: version 7 has been in place since October 2 at 4:40 PM, and "Artikel Webshop" still shows Jun 24, 2026, 9:35 AM. It was the other system that changed: a nightly update of the shop added a required field that the route's mapping leaves open.
This is the most common case, and the way to deal with it is When a connected system changes. In the example, it was fixed in the shop at 1:40 PM; routes and snapshots in Xchange stayed as they were. After that, all that remained was to catch up on what had been left behind.
Where the cause lies outside
Some causes lie outside Xchange, and the UI shows them only as a missing answer.
How you recognize this case:
- The runs are successful and empty. Route Operating, last run Succeeded, History empty. Xchange has worked and found an empty inbox. Why the source system stayed silent, only the source system knows.
- The error message comes from the other system. Where the plain-language text shows a foreign wording — a rejection text, a status code of the other system — the finding is complete, and the fix lies there. Xchange has correctly reported what it was answered.
- The answer does not come. The cause Deadline exceeded means exactly that: the answer came later than intended or not at all. Whether the target system was down or only slow looks the same from here.
In all three cases, your next step leads out of Xchange: to a conversation with the people responsible for the other system. What you take along: the time, the key of the record and the wording of the answer. Where these three details are is shown in Find and trace a single job.
What comes next
- Something is in Clarification: Resolve a clarification.
- There are many of the same kind: Retry failed jobs.
- Everything succeeded, and yet something is missing: Push manually.
- The other system has changed: When a connected system changes.
See also
- Execution (reference) — state, last run and operational information in detail.
- History (reference) — the filters, the columns and all statuses of a job.
- Clarification (reference) — all causes and cause groups.
- Overview (reference) — Action required and how far the key figures reach.